WHAT IS Prashti ?
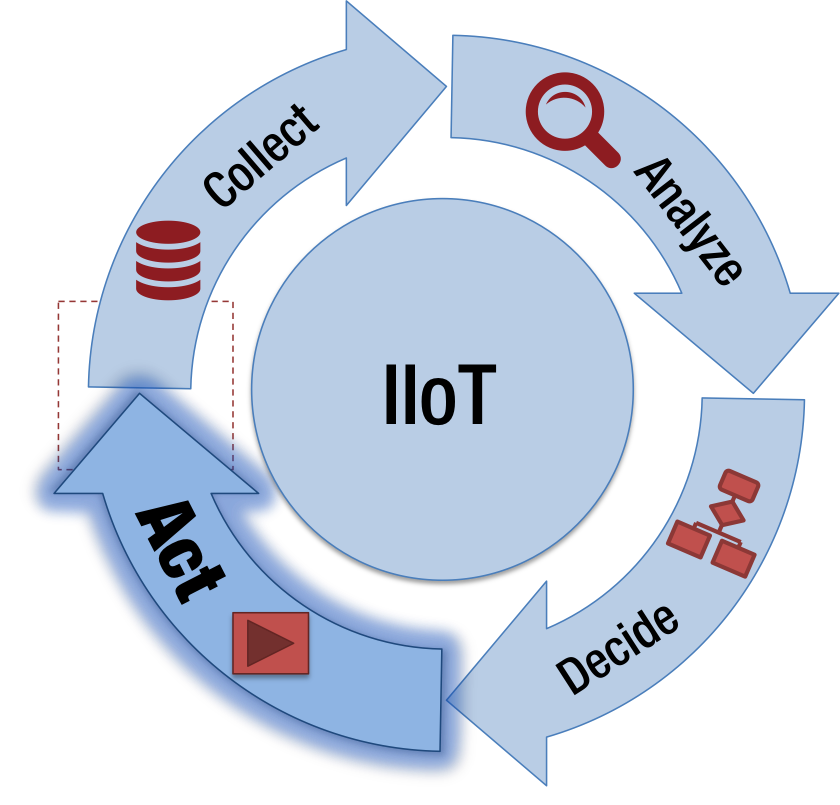
Prashti is an IIoT based Platform, which powers the ability of data to help enterprises to modernize & simplify Asset Management. It enables overall effectiveness of equipment, production costs reduction, Asset Performance benchmarking and Sustainability in operations.
ABOUT US
Industrial IoT (IIoT) Solutions For Industry 4.0
We have the extended team comprises ERP implementors, Energy Auditors, consultants, and software developers. Founders are serial entrepreneurs and with an existing Process Automation solutions business.We are working in Industrial IoT (IIoT) space with our corporate office located at Pune. We are helping industries in OEE, production costs reduction, Asset Performance benchmarking and Sustainability in operations.
OUR SERVICE
WHY US
SOLUTIONS
Utility Monitoring – e _UT
Prashti provides utility consumption acumens, which can reduce up to 30% utility costs in Industries.
Energy expenditures (electricity, diesel, coal, steam, gas, cooling water, chilled brine, compressed air etc.) are major operational costs for an enterprise and these costs continue to upsurge. The cost upsurge and expenditure can be contained by improving energy efficiency.
Prashti addresses this very need by bringing features of smart Energy Management by integrating IoT devices. Prashti tracks, analyses and generate insights into energy consumption and its pattern. Data collection is Flawless, Self-directed and Automatic. The historical Data insights appropriates energy efficiency and improvement measures can be integrated.
Key Features

Real Time Data Monitoring
Energy consumption for multiple machines & devices; Verify impact of energy saving measures

Automation
Automation of the manual reading collection and data Storage

Real Time & Predictive Alerts
Alerts/ Alarms for consumption over and above pre-defined thresholds

Scalable
Solution is modular, flexible suitable to variousindustries.
Integration
Integration of ERP, SCADA, DCS for further analysis & insights

Reports
Schedule, customised reports for comparingutility performance & diagnostics.
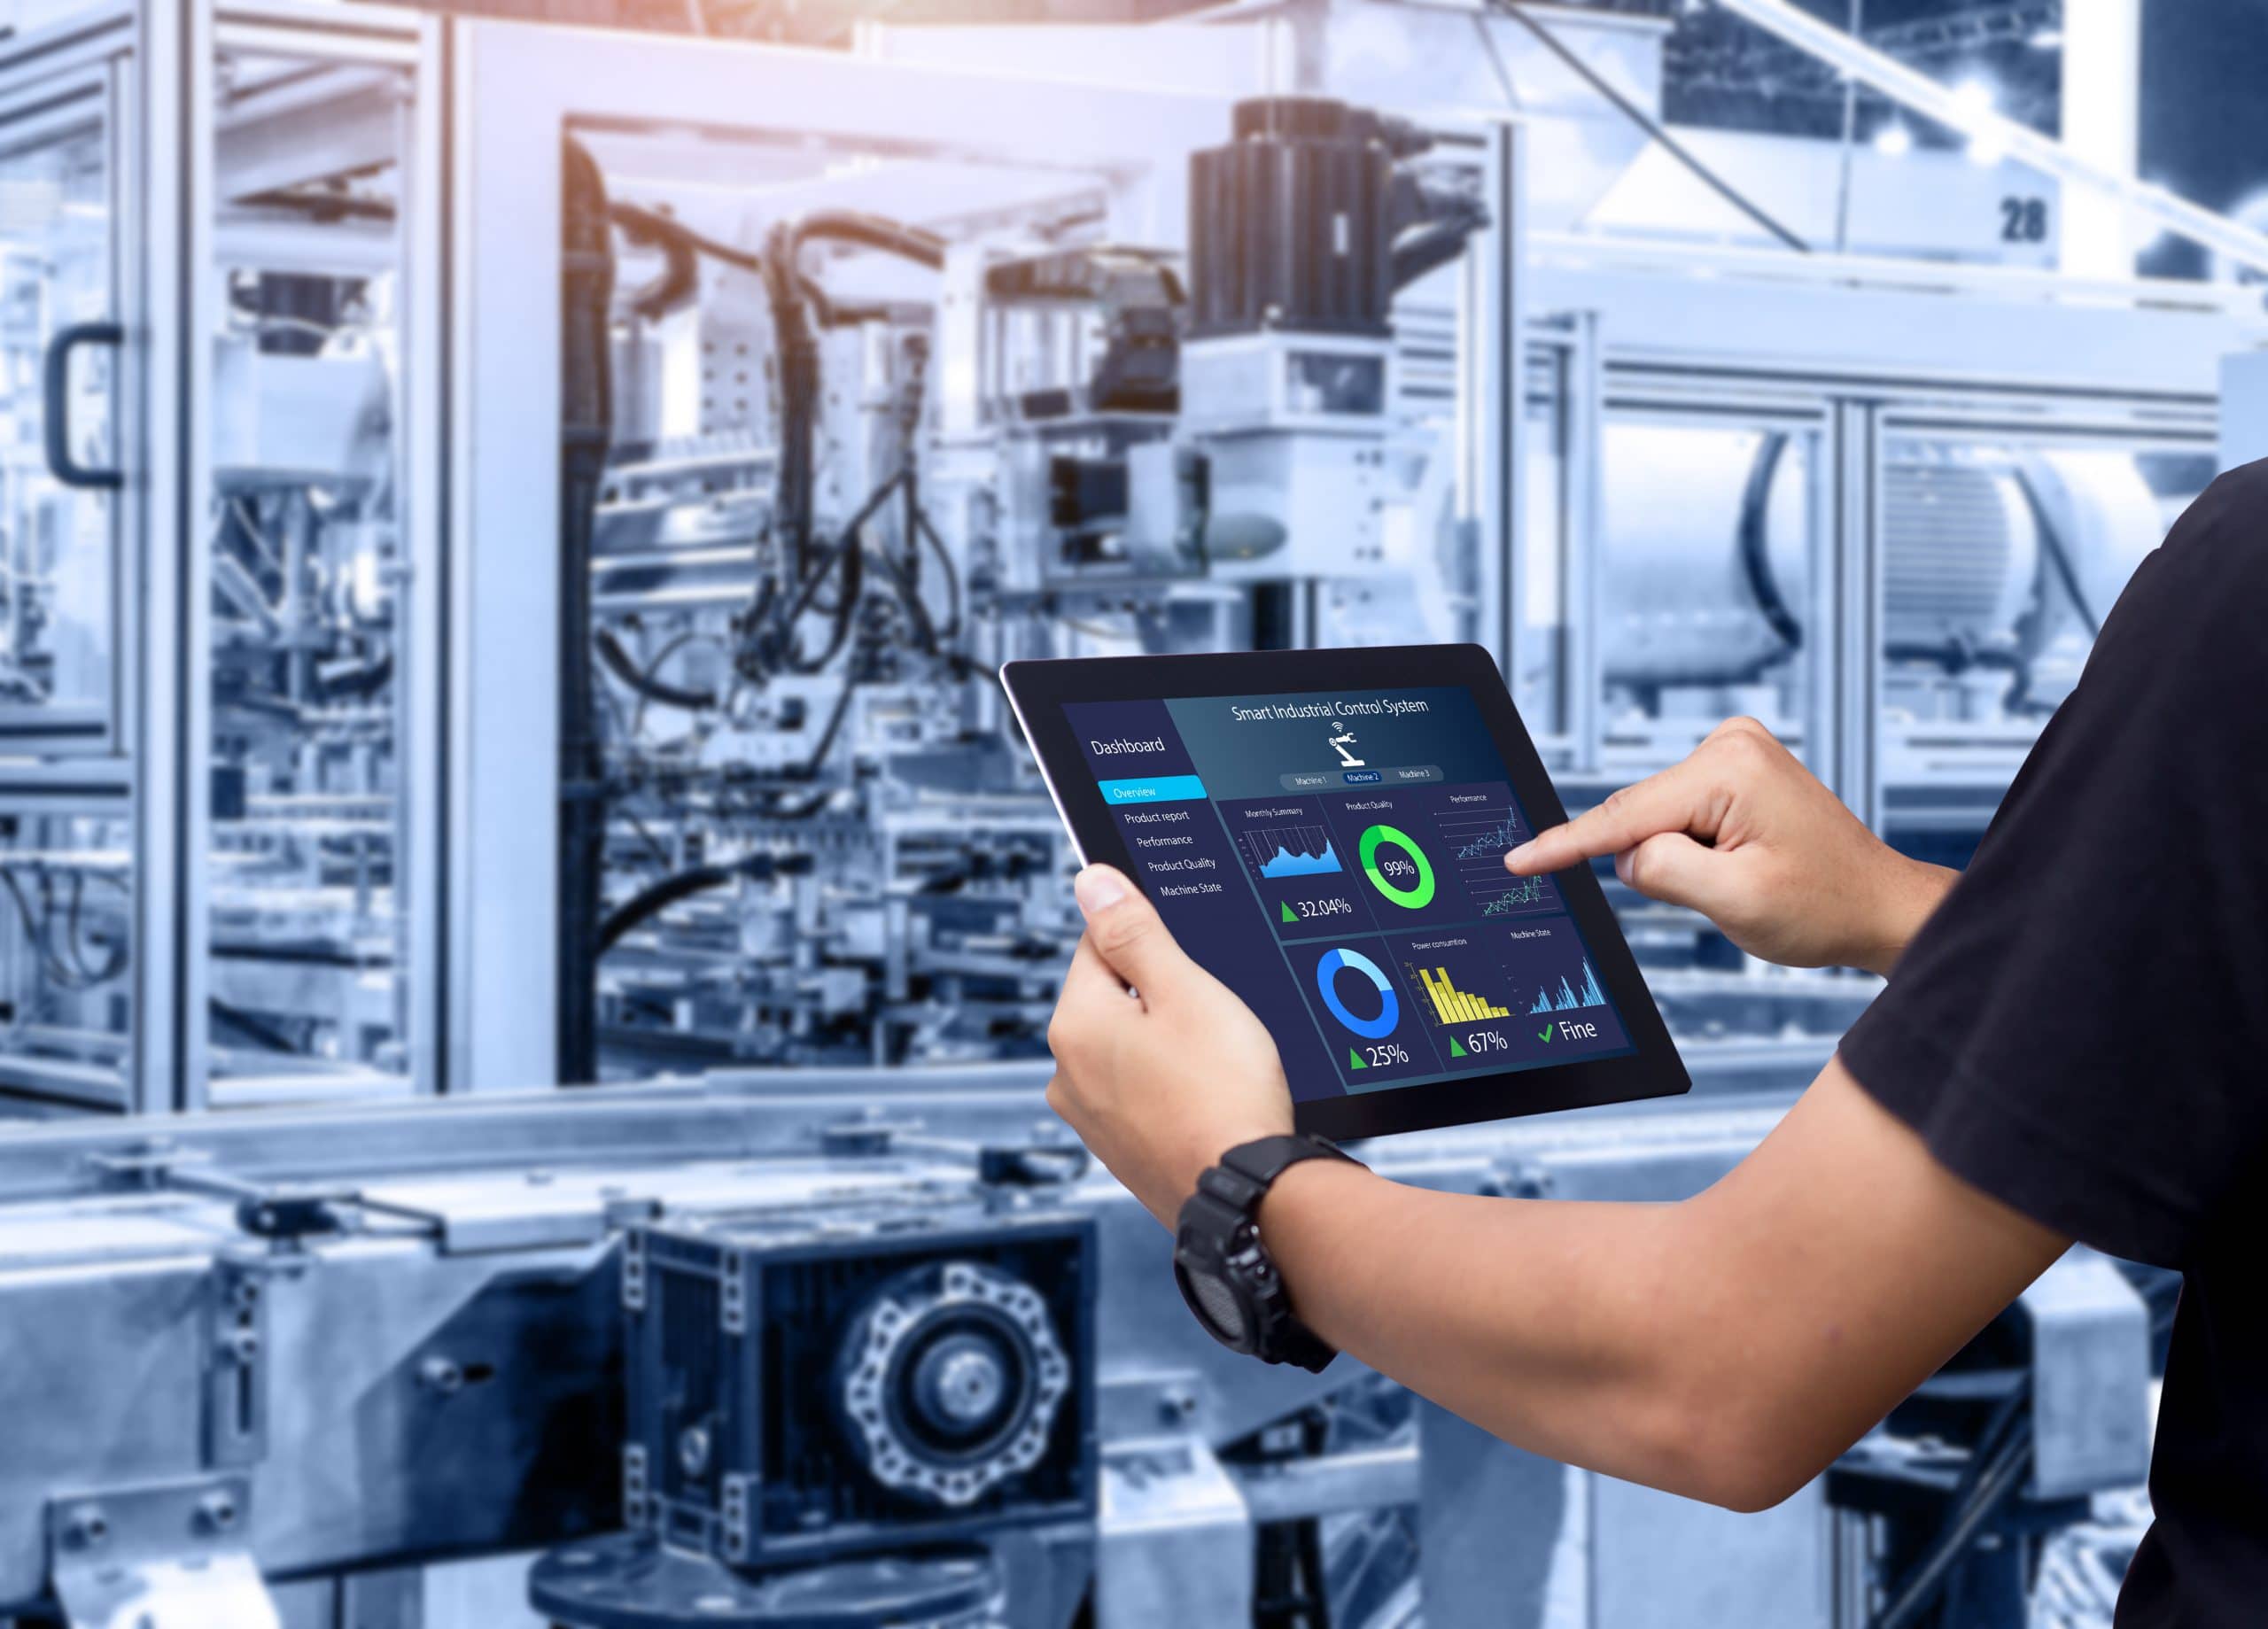
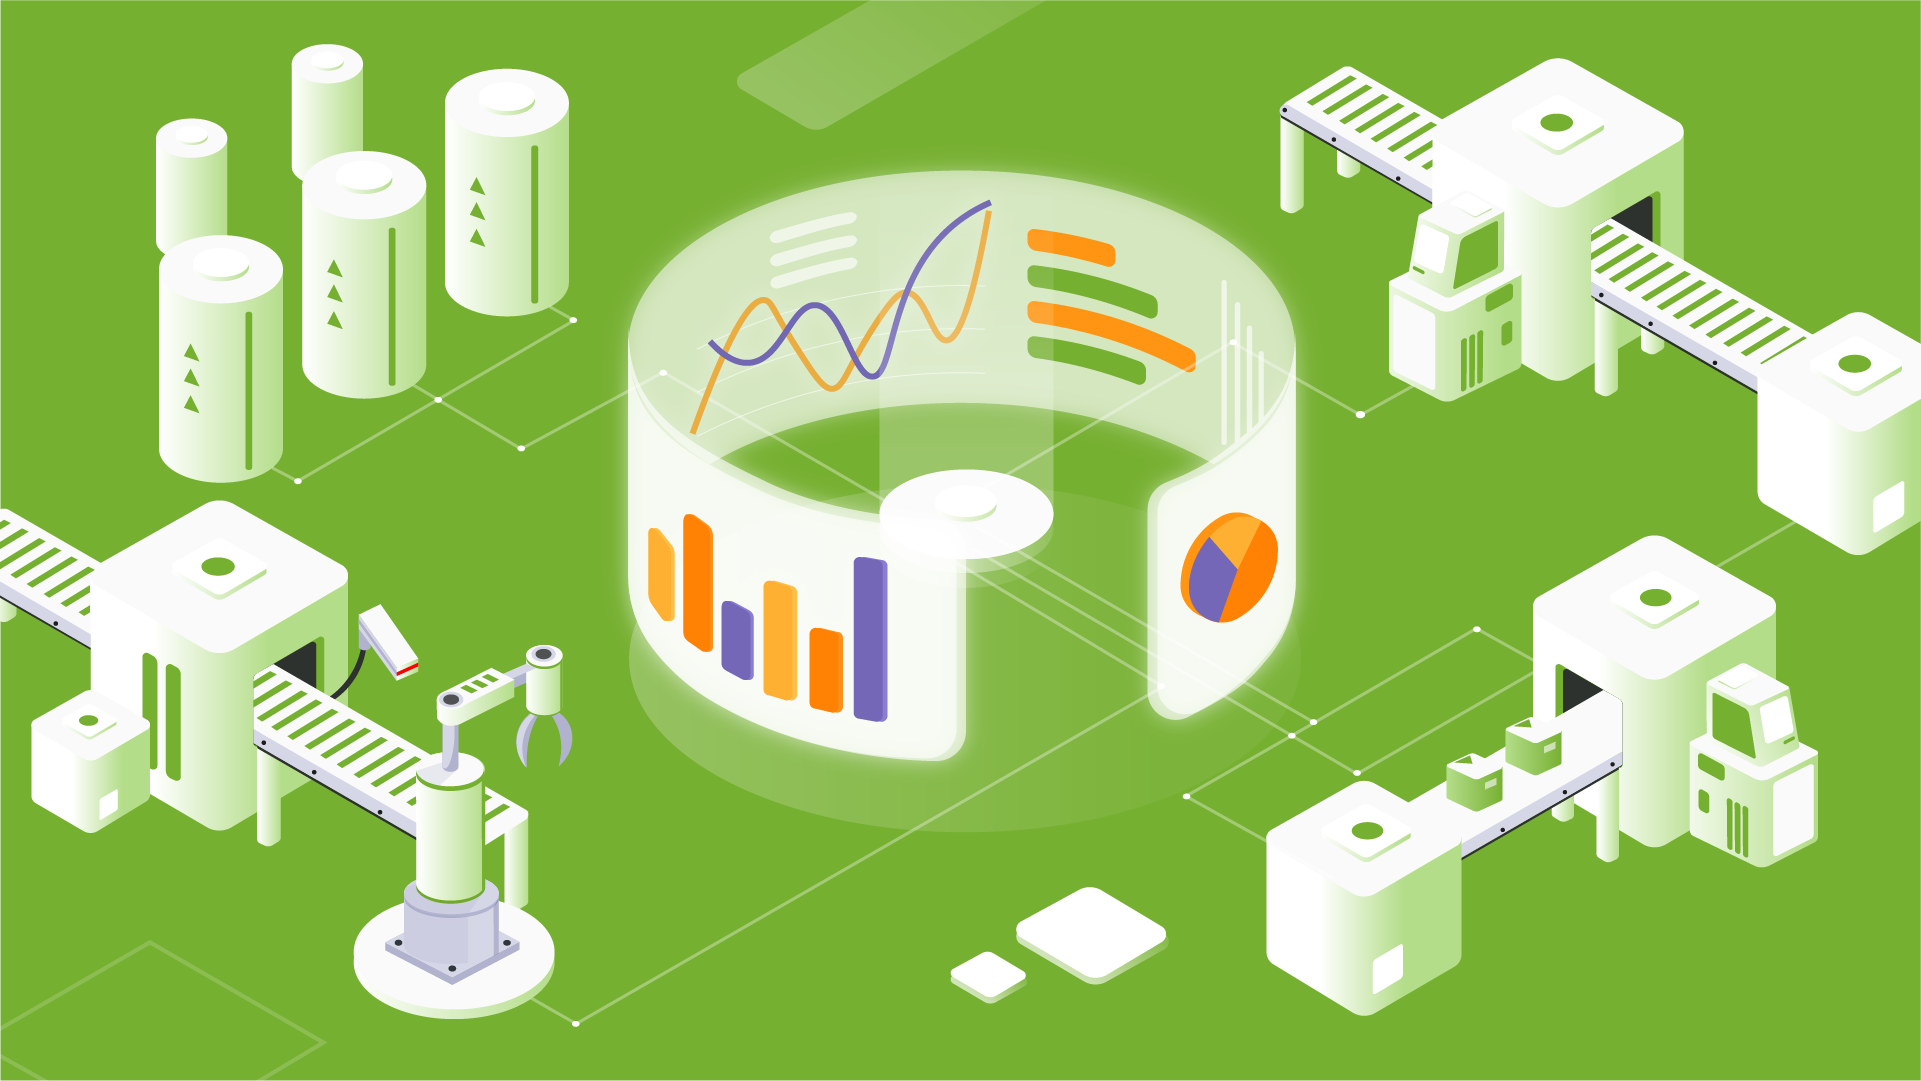
- Prashti gives a comprehensive view of what’s happening across the manufacturing area in real-time and all on single screen.
- Prashti collects data from the Equipment, machines and systems across the manufacturing unit and converts it into clear, actionable insights to improve your decision-making. With this insights, you can improve efficiency, equipment effectiveness, and the productivity of manufacturing operations.
- With Prashti a truly effective production monitoring system our customer has achieved up to 57% increased productivity. Prashti will help to realize the benefits—in efficiency and in bottom line — in no time.
Key Features


Real Time Visibility
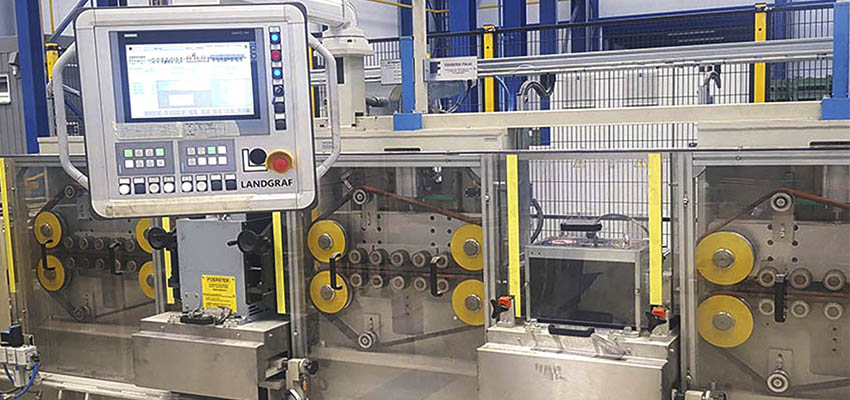
Real time Process Monitoring and Data collection for analysis.

One Plant One Display
Integrate all parts of your production line into one display


Track & Identify
Automatically track key metrics, like overall equipment effectiveness (OEE) & KPI.

Improvement
future-proof & Support continuous improvement of processes and cut waste.

Integration
Integration of ERP, SCADA, DCS for further analysis & insights

Reports
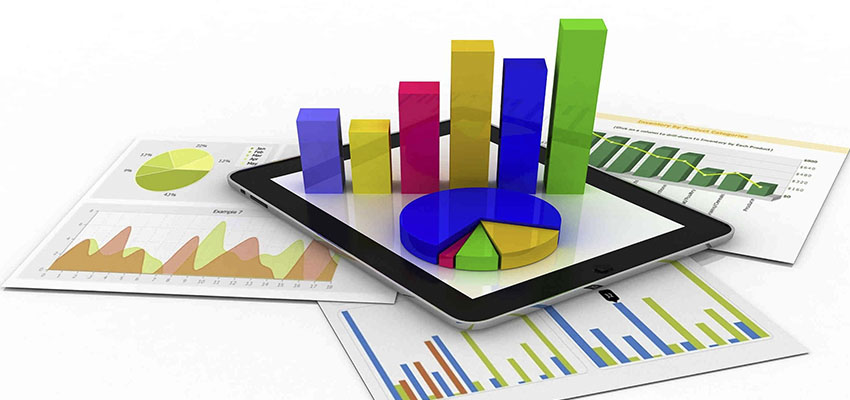
Schedule, customized reports for performance & diagnostics comparison with historic data.
REAL-TIME DASHBOARDS
Informational Dashboard
Informational Dashboard
Analytical Dashboard
Analytical Dashboard
Operational Dashboard
Operational Dashboard

Product Dashboard

Product Dashboard

Departmental Dashboard

Departmental Dashboard

Progress Dashboard

Progress Dashboard
Research Dashboard
Research Dashboard
REPORTS
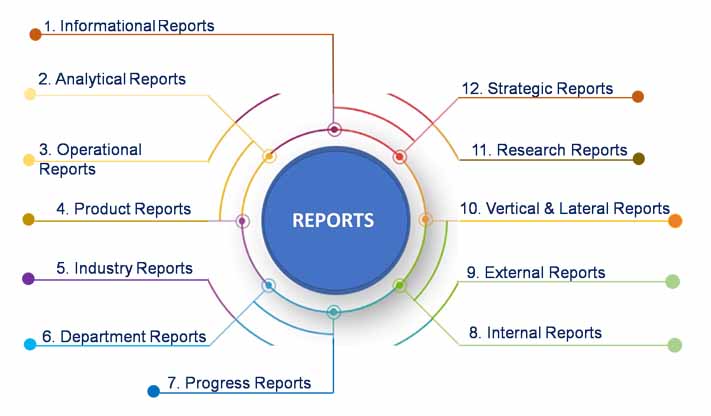

Informational Reports

Informational Reports

Analytical Reports

Analytical Reports
Operational Reports
Operational Reports
Product Reports
Product Reports

Industry Reports

Industry Reports

Department Reports

Department Reports
Progress Reports
Progress Reports

Internal Reports

Internal Reports

External Reports

External Reports

Vertical & Lateral Reports

